Page Summary
For a long time, the stocks have been viewed as the most interesting asset when talking about investment opportunities. And rightfully so, owning a stock basically means you own and are a part of a small portion of a business. Shares can be bought by almost anyone willing to invest some money.
Each day of the week there are millions of orders made using traditional financial institutions. Every time a buyer and a seller agree on a price, and order is executed. This means the market acts as an auction house. A stock quote is made when the key information is transmitted to the exchanges. Before fully understanding what the stock quote is, you must first understand the key data and what it means. This is also the basic information you need to know before trading in stocks.
In the beginning, this information might sound intimidating but once you break it down it’s easy to understand.
How to understand the Stock Quote Data
Whenever an order is placed, a few crucial pieces of data need to be presented. The security of interest, the ticker symbol, the price the trader is willing to buy or sell the shares at, and the number of shares.
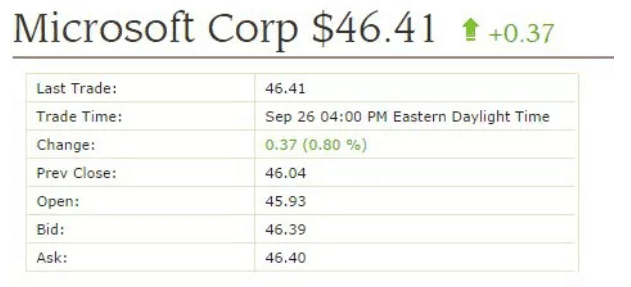
Here is an example of a stock quote:

The bid and ask prices presented on a stock quote translates to the highest bid price and the lowest asking price for the specific asset. In the above example (XX), you can see the highest price any buyer is willing to pay is $XX. You can also see the lowest price at which the sellers are ready to sell at $XX.
Some stock quotes will also include the number of shares that can be traded for the bid and asking price. Stock prices are essentially changes in the supply and demand of the market. As more traders wish to purchase shares, the cost of the security rises. On the other hand, when there are more people willing to sell, accessible, the available stock will cause the price to drop.
The information point found in the “last trade” bracket is the cost at which the last trade was made. This figure is regularly contrasted with the end price from the previous trading session. After a trading session is done, the last exchanged value is applied to make different charting types, for example, candlestick charts.
The opening price is the primary exchange value that was recorded during the day’s exchange – this number is regularly connected to the present cost or the end cost from the previous trading session to try to determine the momentum. A significant change between the last exchanged cost and its open by and large means that a stock is having a solid upward momentum. It frequently means a fascinating trading opportunity. The day’s high and low are another basic information found inside the stock quote. This information is commonly used as an indicator of volatility.
Stock Liquidity
Stock liquidity shows you how easy it is to sell or buy shares of a security without influencing the asset’s price.
For instance, if you bought a stock at 10 and sold it right away for the same price, the market for that asset is completely liquid. However, if you couldn’t sell the stock at all it would mean the market is completely illiquid. Both mentioned situations almost never happen. Most of the market lies somewhere between the two extremes.
Keep in mind that liquidity is somehow subjective as no amount of stock will tell you exactly how liquid an asset really is. However, you can see some differences in general price movements.
Bid-Ask Spread and Volume
The bid-ask spread and volume of stock are closely correlated to liquidity. As previously mentioned, the bid means the highest price buyers are willing to pay for an asset while the ask represents the lowest price at which the sellers are ready to sell. As the two prices have to meet for the trade to happen, a big bid-ask spread means low volumes of the stock and a small bid-ask spread means a high volume of traded stock.
For instance, a bid of $6 and an approach of $7 for stock XYZ is quite a large spread – the buyer and the seller are far apart. No trade can happen until the buyer and seller meet at a certain price. IF this large bid-ask spread persists, only a handful of transactions will happen and the liquidity will be poor.
But, if for example, there is a bid of $6 and an ask of $6.05 for a stock A, this would mean that buyers and sellers are really close to matching each other’s price. This means a higher volume of trades and high liquidity for the stock A.
Stock Quote data on a Stock Chart
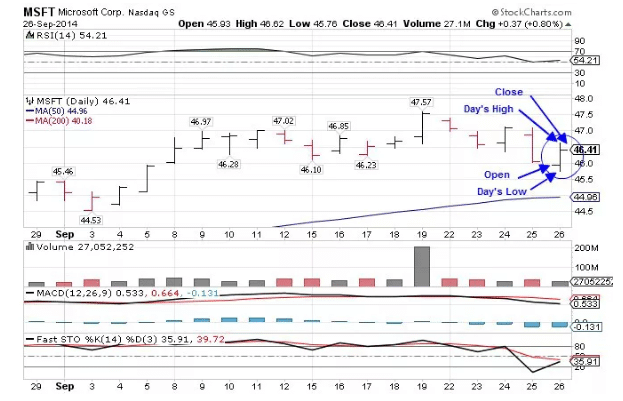
One of the most well known charting types includes stock information by featuring the open, high, low and close. As should be obvious from the outline underneath, the numbers on the bar show the value levels where XX opened and closed.

The left bar shows the open while the right bar indicates the close. You’ll likewise see that in the circumstance where the close is underneath the open, the bar will be red. The highest point of the bar translates to the day’s high while the absolute bottom of the bar indicates the day’s low.
Statistics
Looking a bit further into the numbers on a stock quote can uncover much more helpful data. It can be incredibly valuable when looking at companies in similar industries. Market capitalization means the complete value of all the organization’s shares, expressed in dollars.
Shares short is the complete number of shares sold short – shorted shares are borrowed with the expectation that their price will go down in the future. A short percentage shows how many shares have been shorted compared to all the outstanding shares that haven’t been closed or covered. Traders are looking at this number to try to determine the market direction and traders’ sentiment.
The dividend is a representation of the amount paid per share. The ex-dividend date is the date on which a stock owner is still eligible for a dividend. Should a trader buy the stock on the date or later, he is no longer entitled to the dividend.
The pay date is the day the dividend will be paid to investors. The dividend yield is the rate paid out per share on a yearly basis (relative to the share price).
Earnings per share is the total number of earnings paid per share over the last 12 months, Price-to income ratio, or P/E, is a proportion that estimates the degree of profit in respect to the price. This ratio can be used in figuring out which companies are more valuable. Regularly, a lower P/E is great when comparing companies from a similar industry.
Last but not least, beta shows a security’s reaction to the general market. For instance, a beta of one shows the stock moves exactly like the market, while a beta of 1.15 demonstrates the stock moves 15 percent more than the market.
Conclusion
Stock statements comprise of numerous data points. If you are a trader it is important that you understand the key data points like bid, ask, low, open and close. Knowing this information enables traders to analyse the market and know how to invest in stock market.
Don’t be discouraged by all the different numbers shown by the stock quote. Quotes are a very useful way of comparing different companies from similar industries. This enables you to make some excellent decisions and earn some value while you’re at it.
Invest in gold or forex instead of stocks
Investing in gold or forex can be risky, but it can also be highly lucrative. If you are investing your money the first time than you should at least make some previous investigations and learn te basics about how to trade forex or gold. The next question you will need to answer is which platform you want to trade with. There are several different platforms which all allow islamic forex account but not all of them are the same. We from business24-7 have looked into some of the most popular forex trading platforms to make your decision even easier. One of our favourite brokers are: IQ Options platform, Avatrade platform, eToro platform.
Disclaimer
eToro is a multi-asset platform which offers both investing in stocks and cryptoassets, as well as trading CFDs.
Please note that CFDs are complex instruments and come with a high risk of losing money rapidly due to leverage. 51% of retail investor accounts lose money when trading CFDs with this provider. You should consider whether you understand how CFDs work, and whether you can afford to take the high risk of losing your money
This communication is intended for information and educational purposes only and should not be considered investment advice or investment recommendation. Past performance is not an indication of future results.
Copy Trading does not amount to investment advice. The value of your investments may go up or down. Your capital is at risk.
Don’t invest unless you’re prepared to lose all the money you invest. This is a high-risk investment and you should not expect to be protected if something goes wrong. Take 2 mins to learn more
eToro USA LLC does not offer CFDs and makes no representation and assumes no liability as to the accuracy or completeness of the content of this publication, which has been prepared by our partner utilizing publicly available non-entity specific information about eToro.
