Learn how to calculate the Forward P/E ratio by dividing the current share price by estimated future earnings per share. Includes P/E ratio example and formula.
The PE ratio is the most famous term in fundamental analysis; people who don’t know fundamental analysis properly even know about it. Generally, the PE ratio analyzes a company’s valuation based on its price and earnings. Similarly, if you want to analyze the future valuation of a company based on the price and earnings, it is known as the forward PE ratio.
By definition, the forward P/E ratio is a valuation metric used to assess a company’s stock price relative to its expected future earnings. Unlike the trailing P/E ratio, which focuses on past earnings, it provides a forward-looking perspective. Thus, it is a valuable tool for investors interested in identifying growth opportunities in a company.
How the Forward P/E Ratio is Calculated

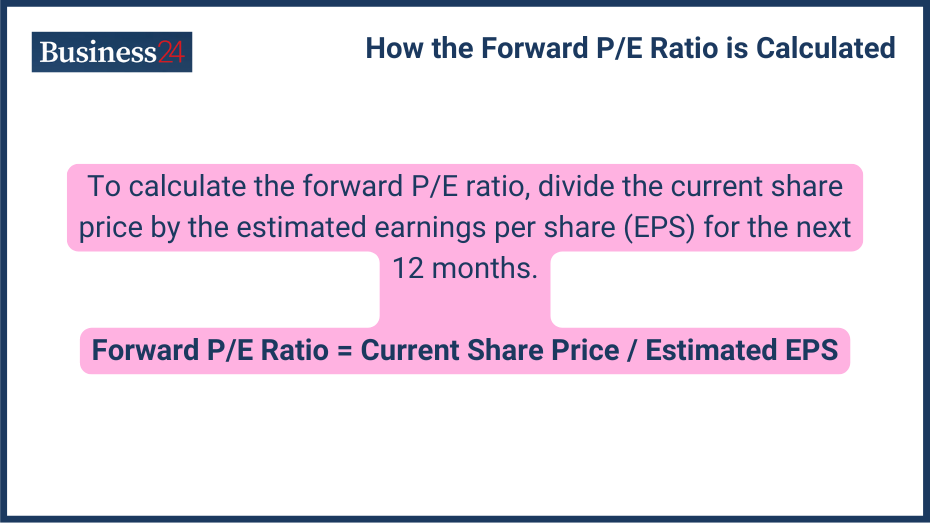
To calculate the forward P/E ratio, divide the current share price by the estimated earnings per share (EPS) for the next 12 months.
- Forward P/E Ratio = Current Share Price / Estimated EPS
For example, Let’s say a stock has a current share price of $20, and this year’s earnings per share (EPS) are $2. Analysts estimate that the company’s earnings will grow by 20% over the next fiscal year. The forward P/E would be $20 / (2.4) = 8.3x.
A lower forward P/E ratio than the current P/E means that analysts expect earnings to go up. On the other hand, a higher forward P/E ratio suggests they expect earnings to decrease. This calculation measures how much investors are willing to pay for each dollar of expected future earnings.
Comparison with Trailing P/E Ratio
The only difference between the trailing P/E ratio and the forward P/E ratio is that the former is calculated from historical earnings, while the latter is calculated from expected earnings. By comparing the forward P/E ratio to the trailing P/E ratio, investors can assess whether the market’s expectations for a company’s future performance are aligned with its past results.
What does forward PE indicate?
The forward P/E ratio reflects what the market expects from a company’s future profits. If the forward P/E ratio is lower than the current P/E, it means analysts believe the company’s earnings will increase. Conversely, a higher forward P/E suggests they anticipate a drop in earnings. However, it’s crucial to also consider other factors, like the company’s industry, its competitive position, and overall economic conditions, when evaluating the forward P/E ratio.
What are the Components of the Forward P/E Ratio?

The forward P/E ratio consists of two primary components:
- Earnings Estimates: These are projections of a company’s future earnings per share, provided by companies as their projections and analysts. Earnings estimates vary widely depending on economic conditions, industry trends, and company-specific factors.
- Current Share Price: This is the current market price of the company’s stock. It is influenced by various factors, including investor sentiment, market conditions, and the company’s financial performance.
Impact of Earnings Guidance
Changes in earnings guidance can significantly impact the forward P/E ratio. If a company raises its earnings estimates, the forward P/E ratio will likely decrease, indicating a more attractive valuation. Conversely, decreased earnings guidance can lead to a higher forward P/E ratio.
What are the Benefits of Using the Forward P/E Ratio?
The benefits of using a forward P/E ratio are:
- Predictive Value: The forward P/E ratio provides a forward-looking perspective so investors can decide on a company’s valuation and growth. By focusing on future expectations, the forward P/E ratio can help investors anticipate changes in a company’s valuation before they occur.
- Comparison Across Companies: The forward P/E ratio can be used to compare the valuations of different companies within the same industry. By comparing the forward P/E ratios of similar companies, investors can identify potential mispricings and undervalued or overvalued stocks.
- Anticipating Future Performance: By analyzing the forward P/E ratio, investors can assess whether a company’s stock price is aligned with its expected future growth potential. Some guidance on future performance is important for an investor to hold a stock with conviction, and a forward P/E ratio can provide some information about a company’s future.
- Investment Decision Making: The forward P/E ratio can be valuable for making investment decisions. By understanding it and its implications, investors can identify potential investment opportunities and avoid overpaying for stocks.
What are the Limitations of the Forward P/E Ratio?
Limitations of the Forward P/E Ratio are:
- Accuracy of Earnings Estimates: The accuracy of forward earnings estimates can vary, and errors in these estimates can lead to inaccurate valuations. Analysts may have different assumptions about a company’s prospects, which can result in varying earnings estimates. This wrong estimate can be hazardous for investors with companies in their holdings.
- Susceptibility to Analyst Bias: Analyst biases can influence earnings estimates, potentially distorting the forward P/E ratio. Analysts may have personal or professional incentives to provide overly optimistic or pessimistic earnings estimates.
- Market Volatility Impact: Market volatility can significantly impact the forward P/E ratio, making it difficult to assess a company’s value in the short term. Short-term fluctuations in the market can cause the forward P/E ratio to fluctuate, even if the company’s underlying fundamentals remain unchanged.
- Comparison with Historical Data: Historical P/E ratios are important to consider in order to gain a more comprehensive understanding of a company’s valuation. Investors can assess whether the current valuation aligns with historical norms by comparing the forward P/E ratio to the company’s historical P/E ratios.
What is the Process of Calculating the Forward P/E Ratio?
Step-by-step process of calculating the forwards P/E:
Step 1: Gather Earnings Estimates
Collect the consensus analyst estimates for the company’s earnings per share for the next 12 months, or you can go through the company’s projection from interviews. These estimates can be found in analyst reports, financial news websites, or economic data terminals.
Step 2: Determine the Current Share Price
Get the current market price of the company’s stock. You can find the price of a stock on exchanges, websites, or financial data terminals.
Step 3: Calculate the Forward P/E Ratio
Divide the current share price by the estimated EPS. This calculation will provide the company’s forward P/E ratio.
Step 4: Adjustments for Extraordinary Items
If necessary, adjust the earnings estimate to exclude any extraordinary items that may distort the company’s financial performance. Extraordinary items are one-time events that are not expected to recur in the future, such as gains or losses from asset sales or lawsuits.
What are the Applications of the Forward P/E Ratio in Valuation?
Applications of the forward P/E ratio in valuation are:
- Assessing Company Valuation: The forward P/E ratio can assess whether a company’s stock is overvalued, undervalued, or fairly valued. A low forward P/E ratio may suggest that a stock is undervalued, while a high forward P/E ratio may indicate overvalued. However, considering the company’s growth prospects, competitive position, and industry trends is also important.
- Comparing Industry Peers: Investors can identify potential mispricings by comparing the forward P/E ratios of similar companies within an industry. If a company’s forward P/E ratio is significantly higher or lower than its peers, it may indicate that the stock is overvalued or undervalued.
- Identifying Overvalued and Undervalued Stocks: A low forward P/E ratio may suggest that a stock is undervalued, while a high forward P/E ratio may indicate overvalued. However, when identifying overvalued or undervalued stocks, it is essential to consider other factors, such as the company’s growth prospects, competitive position, and industry trends.
- Integrating with Other Financial Metrics: The forward P/E ratio can be used with other financial metrics, such as revenue growth, profit margins, and debt levels, to provide a more comprehensive analysis. Investors can make more informed decisions about investing in a particular company by considering multiple factors.
What are the Key Differences Between Forward P/E and Other Valuation Ratios?
Difference between Forward P/E and other metrics:
- Forward P/E vs. PEG Ratio: The PEG ratio adjusts the forward P/E ratio for expected growth. It is calculated by dividing the forward P/E ratio by the company’s expected growth rate. The PEG ratio provides a more comprehensive valuation metric by considering both the forward P/E ratio and the company’s expected growth rate.
- Forward P/E vs. Price-to-Sales Ratio: The price-to-sales ratio compares the company’s market capitalization to its annual revenue. It is useful for valuing companies that may have different earnings. The price-to-sales ratio is often used for companies in the early stages of growth or industries with low profit margins.
- Forward P/E vs. EV/EBITDA: The EV/EBITDA ratio compares a company’s enterprise value (market capitalization plus debt minus cash) to its earnings before interest, taxes, depreciation, and amortization.
What are the Factors Influencing the Forward P/E Ratio?
Some of the factors influencing the forward P/E ratio:
- Economic Conditions: The overall economic environment impacts the forward P/E ratio, affecting investor sentiment and company performance. During periods of economic growth, investors may be more willing to pay higher prices for stocks, leading to higher forward P/E ratios. Conversely, during economic downturns, investors may become more cautious and demand lower valuations, resulting in lower forward P/E ratios.
- Company Growth Prospects: The market’s expectations for a company’s future growth potential are reflected in its forward P/E ratio. Companies with strong growth prospects are likely to have higher forward P/E ratios, as investors are willing to pay a premium for their future earnings potential. Conversely, companies with slower growth prospects may have lower forward P/E ratios.
- Industry Trends: Industry-specific factors, such as technological advancements or regulatory changes, can influence the forward P/E ratios of companies within that industry. For example, industries experiencing rapid technological advancements may have higher forward P/E ratios due to the potential for significant growth.
- Changes in Earnings Projections: Any changes in analyst estimates for a company’s future earnings can lead to fluctuations in the forward P/E ratio. If analysts raise their earnings estimates, the forward P/E ratio will likely decrease, indicating a more attractive valuation. Conversely, if analysts lower their earnings estimates, the forward P/E ratio will likely increase, indicating a less attractive valuation.
What are the Common Misconceptions About the Forward P/E Ratio?
- Overreliance on Forward Estimates: Relying solely on forward earnings estimates without considering other factors can lead to inaccurate valuations. The forward P/E ratio should be used in conjunction with other valuation metrics and qualitative factors to get a more comprehensive understanding of a company’s value.
- Ignoring Qualitative Factors: The forward P/E ratio should not be used in isolation. It is important to consider qualitative factors, such as management quality, competitive advantage, and industry trends, when assessing a company’s valuation. These factors can significantly impact a company’s prospects and forward P/E ratio.
- Misinterpreting High or Low Ratios: A high forward P/E ratio doesn’t necessarily indicate an overvalued stock, and a low forward P/E ratio doesn’t always mean a stock is undervalued. When interpreting the forward P/E ratio, it is important to consider the company’s growth prospects, industry trends, and other factors.
- Using Forward P/E in Isolation: The forward P/E ratio should not be used in isolation. It should be considered in conjunction with other valuation metrics and financial analysis. Investors can get a more accurate and comprehensive assessment of a company’s value using multiple valuation methods.
FAQs
Q. What is a good forward P/E ratio?
- There is no definitive answer to this question, as a good forward P/E ratio depends on a variety of factors, including the company’s industry, growth prospects, and market conditions. However, a forward P/E ratio significantly lower than the industry average may suggest that a stock is undervalued. In contrast, a forward P/E ratio substantially higher than the industry average may suggest that a stock is overvalued.
Q. What is the forward P/E ratio of the S&P 500?
- The S&P 500’s forward P/E ratio fluctuates over time, but it is generally considered a benchmark for the overall stock market. A higher forward P/E ratio suggests that investors are optimistic about the economy and stock market, while a lower forward P/E ratio suggests that investors are more cautious.
Q. How do I calculate the forward P/E ratio?
- To calculate the forward P/E ratio, divide the current share price by the estimated earnings per share for the next 12 months.
Q. What is the difference between forward P/E and trailing P/E?
- The key difference between forward P/E and trailing P/E is the time frame. Forward P/E focuses on future expectations, while trailing P/E looks at past performance.
Disclaimer
eToro is a multi-asset platform which offers both investing in stocks and cryptoassets, as well as trading CFDs.
Please note that CFDs are complex instruments and come with a high risk of losing money rapidly due to leverage. 51% of retail investor accounts lose money when trading CFDs with this provider. You should consider whether you understand how CFDs work, and whether you can afford to take the high risk of losing your money
This communication is intended for information and educational purposes only and should not be considered investment advice or investment recommendation. Past performance is not an indication of future results.
Copy Trading does not amount to investment advice. The value of your investments may go up or down. Your capital is at risk.
Don’t invest unless you’re prepared to lose all the money you invest. This is a high-risk investment and you should not expect to be protected if something goes wrong. Take 2 mins to learn more
eToro USA LLC does not offer CFDs and makes no representation and assumes no liability as to the accuracy or completeness of the content of this publication, which has been prepared by our partner utilizing publicly available non-entity specific information about eToro.
