Discover how volatility measures the dispersion of returns for securities and market indexes. Learn its impact on investment decisions and market trends. Understand volatility to make informed financial choices.
In the market, price doesn’t stay at a single point; frequent buying and selling are continuously happening, and that creates volatility in the price. By definition, we can say that volatility is a financial term that quantifies the extent and frequency of price fluctuations within a market. It works as a measuring tool for market instability, measuring the degree to which asset prices fluctuate rapidly and unpredictably over time.
Some markets are highly volatile and show high price swings, like the cryptocurrency market, and some markets, like forex, are less volatile, where price swings are much lower and price movements are relatively stable.
What is volatility in simple terms?
In simple terms, Volatility is a measure of how much an asset’s price moves up and down over a given period. It tells the degree of price fluctuations, providing insights into the market’s overall stability or instability. For example, a stock with high price fluctuation means high volatility provides better opportunities for traders to capture these price swings and profit from them.
What are some volatility examples?

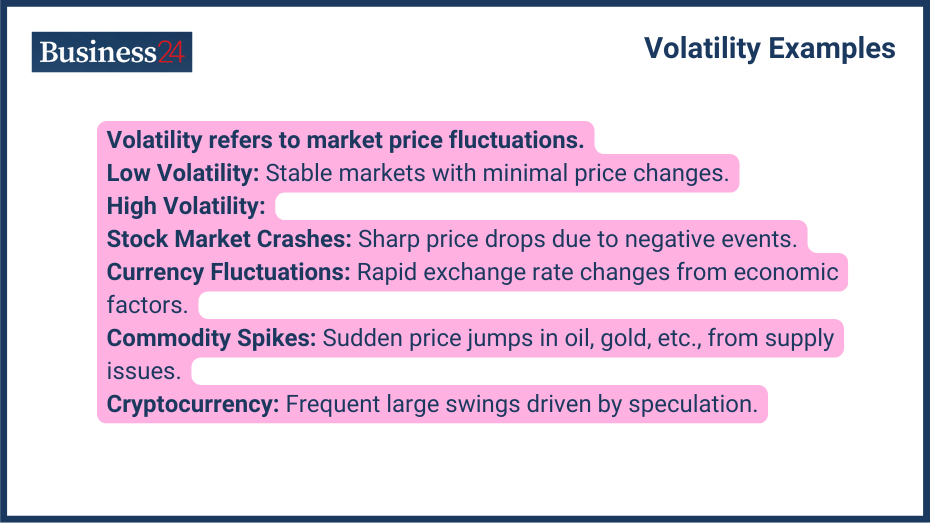
Volatility is simple price fluctuation, so there are no examples of volatility, but there are examples of high volatility and low volatility in the market; a simple day-to-day market is an example of low volatility where price actions do not make high fluctuations; here are some of the example of high fluctuations:
- Stock market crashes: Any bad news or other event that affects the economy badly leads to crashes in the stock market; these specific events in the market are highly volatile and can produce high price swings.
- Currency fluctuations: Due to interest differentials, trade imbalances, and political instability in any economy, currency fluctuations can increase, which leads to rapid changes in exchange rates; this is also an example of high volatility.
- Commodity price spikes: Sudden and dramatic increases in the prices of commodities like oil, gold, or agricultural products due to supply shortages, geopolitical tensions, or increased demand.
- Cryptocurrency price volatility: The highly volatile nature of cryptocurrency markets is characterized by frequent and large price swings, often driven by speculation and market sentiment.
What is the Measurement of Volatility?
Common metrics to measure volatility:
- Standard Deviation: Standard deviation is a mathematical tool and the most common statistical measure of volatility. It quantifies the dispersion of a dataset from its mean. In the context of finance, it measures the extent to which asset prices deviate from their average values. A higher standard deviation indicates greater volatility, meaning high price fluctuations.
- Variance: The square of the standard deviation is called variance. Variance provides another measure of volatility; while less intuitive than standard deviation, it is often used in statistical calculations.
- VIX (Volatility Index): from active traders or at the time of events, you will often hear about VIX, which is also known as the fear index. VIX is a popular measure of market volatility based on indexes like S&P 500 index options. It reflects investor expectations of market volatility over the next 30 days.
Tools and Indicators Used by Traders
- Bollinger Bands: These bands plot two standard deviations above and below a simple moving average, providing a visual representation of price volatility. If the price is giving, frequent wicks above and below these ranges are an indication of high volatility.
- Average True Range (ATR): This indicator measures market volatility by calculating the average price range over a specific period. ATR is also highly used by traders to calculate stop loss.
- Historical Volatility: Recurring events like interest rate changes can be studied, and the analysis of volatility can be applied to the same event happening next time. These studies can help prevent losses amid high volatility.
- Implied Volatility: Derived from option prices, implied volatility reflects market expectations of future volatility. It helps traders analyze option contracts and make decisions based on them.
Is high volatility a good thing?
The perception of high volatility as “good” or “bad” depends largely on an investor’s risk tolerance and investment horizon. For short-term traders, high volatility can present opportunities to profit from rapid price movements. However, for long-term investors, high volatility can increase the risk of losses. Ultimately, the impact of volatility depends on an individual’s investment objectives and risk profile.
What Causes Market Volatility?

There are various reasons that cause market volatility:
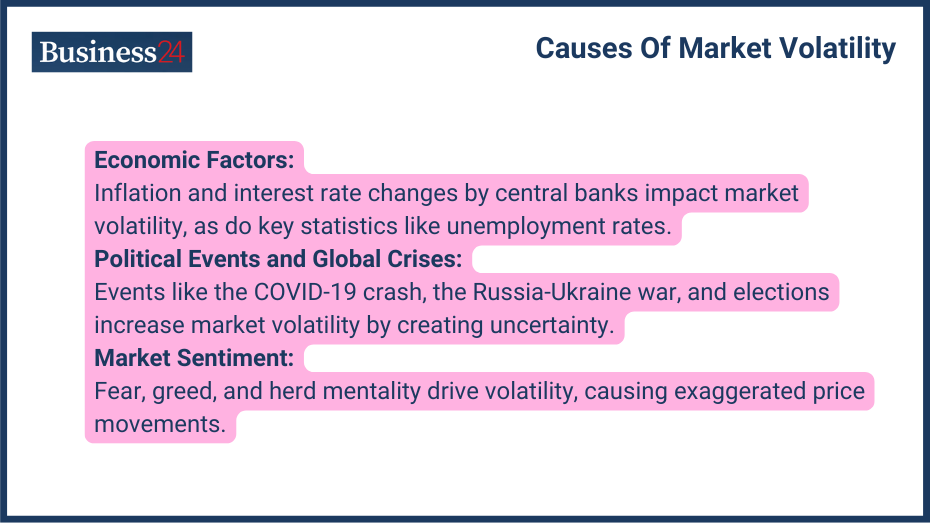
- Economic Factors:
Every asset is directly or indirectly affected by economic changes. Whenever inflation rises, the central bank controls it by raising interest rates, which affects businesses and their bottom lines. Changes in interest rate policies implemented by central banks significantly influence market volatility.
Major statistics, such as employment figures, such as unemployment rates, job creation numbers, and economic growth numbers, impact investors’ confidence, hence increasing the volatility in the market.
- Political Events and Global Crises
Various political events and global crises have hugely impacted the market; a recent example is the COVID-19 crash. Small market crashes have also been seen on the news of the Russia-Ukrainian war. Conflicts, trade disputes, and geopolitical risks can disrupt global economic activity and lead to increased market volatility.
Political events, such as elections, policy changes, and leadership transitions, can create uncertainty and volatility in financial markets. Natural disasters can cause significant economic disruptions, affecting supply chains, infrastructure, and investor confidence, thereby contributing to market volatility.
- Market Sentiment and Investor Behavior
Market sentiment, influenced by factors such as fear, greed, and herd mentality, amplifies the market volatility. Periods of excessive optimism or pessimism can also lead to exaggerated price movements.
What is the Impact of Volatility on Investments?
Short-Term vs. Long-Term Effects
Generally, investments are long-term, so short-term volatility shouldn’t affect investors. However, short-term volatility can create opportunities for traders, who can take frequent trades based on these volatility levels. Over extended periods, the effects of volatility tend to average out, and the overall trend of the market often prevails. However, investors with a short-term investment horizon may find it challenging to navigate volatile markets, as rapid price swings can disrupt their investment plans.
Impact on Different Asset Classes
There is some effect of volatility on every asset class; some can have minor effects while others can have major effects. Equities are generally more volatile than other asset classes, as a wide range of factors, including company performance, economic conditions, and investor sentiment influence their prices. Also, commodity prices can be highly volatile due to factors such as supply and demand imbalances, geopolitical events, and weather conditions.
Bonds are considered less volatile than stocks, but they are not immune to market fluctuations. Rising interest rates can lead to declines in bond prices, increasing volatility in the fixed-income market.
What are the Strategies for Managing Volatility?
A highly volatile market can lead to higher losses if not managed with strategies; some common strategies for managing volatility are:
Diversification and Asset Allocation
One of the most fundamental and famous strategies for managing volatility is diversification and balanced asset allocation. If you diversify your investments across different sectors and assets, you won’t be impacted by the high volatility of one asset. According to your capital, risk appetite, and return goals, you can balance your portfolio with the optimal proportion of different asset classes within a portfolio.
Hedging Techniques and Use of Derivatives
If you think the price is going in the opposite direction of your investment, you can hedge the position, which will limit your loss. Especially derivatives – future and options are used for hedging purposes. For example, buying put options on a stock can protect against downside risk, while selling call options can generate income but limit upside potential.
Safe-Haven Assets and Their Role
Some of the assets, like gold, government bonds, the US dollar, etc., in any economy are known as safe havens because they are considered to be less volatile during periods of market turmoil. Also, demand for these assets increases during times of uncertainty, providing a degree of portfolio stability.
What is the Role of Volatility in Risk Management?
Potential profit and losses are determined by price changes over time. By understanding volatility, investors can make informed decisions about asset allocation, portfolio construction, and risk mitigation strategies.
High volatility is often associated with higher investment risk, as it signifies greater price fluctuations and the potential for substantial losses. Volatility analysis helps in evaluating portfolio performance under different market conditions, enabling investors to identify potential vulnerabilities.
Volatility in Portfolio Management
Various volatility models are produced to manage portfolio volatility. These models help investors construct portfolios that balance risk and return. At a time of high volatility, you can rebalance the portfolio and remove scripts that can cause major losses. Diversification, hedging, stop loss orders, and position sizing can help investors to mitigate risk.
What are the Psychological Effects of Volatility?
Behavioral finance explores the intersection of psychology and economics, examining how emotions and cognitive biases influence investor behavior. Fear and greed can drive impulsive actions, such as panic selling during market downturns or excessive risk-taking during market rallies.
Another psychological effect on investors is the fear of missing out during high-volatility situations. The tendency to feel the pain of losses more intensely than the pleasure of gains can lead to holding onto losing investments for too long or selling winning investments prematurely.
Common Cognitive Biases and Their Impact
- Confirmation Bias: Confirmation bias is a tendency to seek information that confirms existing beliefs, leading to biased decision-making.
- Anchoring Bias: Overreliance on initial information or price levels, influencing subsequent investment decisions.
- Availability Bias: Overestimating the likelihood of events based on recent or easily recalled information.
- Representativeness Bias: Making decisions based on stereotypes or patterns without considering underlying probabilities.
What are the Regulatory and Market Dynamics Affecting Volatility?
Regulatory bodies such as the Securities and Exchange Commission (SEC) in the United States play a crucial role in maintaining market integrity and stability. Their rules and regulations aim to prevent market manipulation, insider trading, and other fraudulent activities that can contribute to volatility.
Regulatory interventions often focus on risk management practices, requiring financial institutions to implement measures to assess and control their exposure to market volatility. Regulations governing market structure, such as trading systems, circuit breakers, and short-selling restrictions, impact market volatility.
What are the Differences Between Market Volatility and Other Financial Metrics?
Volatility VS Risk
- Volatility: Measures the magnitude of price fluctuations over time.
- Risk: Encompasses a broader spectrum, including the potential for loss, uncertainty, and the likelihood of adverse outcomes. Volatility is one component of overall investment risk.
Volatility VS Beta
- Volatility: Measures the absolute price fluctuations of an asset.
- Beta: Measures the relative volatility of an asset compared to a benchmark index. It indicates how sensitive an asset’s price is to market movements.
Market Liquidity VS Market Depth
- Liquidity: Refers to the ease with which an asset can be bought or sold without significantly impacting its price. While high volatility can sometimes reduce liquidity, the two concepts are distinct.
- Market Depth: Represents the number of buyers and sellers willing to participate in a market at a given price. High market depth can absorb price shocks, reducing volatility.
Bottom Line
To manage the risk and balance the portfolio, knowing about volatility, its cause, and its effect is very important. While volatility can create challenges, it also presents opportunities for those with the right knowledge and strategies.
FAQs
Q. What is the difference between volatility and risk?
A. Volatility is a measure of price fluctuations, while risk encompasses a broader range of potential losses, including credit risk, liquidity risk, and operational risk.
Q. How can I measure volatility?
A. Volatility can be measured using statistical methods like standard deviation, variance, and historical volatility.
Q. What is the relationship between volatility and return?
A. Higher volatility often implies higher potential returns but also higher risk.
Q. How can I protect my portfolio from volatility?
A. Diversification, hedging, and stop-loss orders are effective strategies for managing volatility.
Disclaimer
eToro is a multi-asset platform which offers both investing in stocks and cryptoassets, as well as trading CFDs.
Please note that CFDs are complex instruments and come with a high risk of losing money rapidly due to leverage. 61% of retail investor accounts lose money when trading CFDs with this provider. You should consider whether you understand how CFDs work, and whether you can afford to take the high risk of losing your money
This communication is intended for information and educational purposes only and should not be considered investment advice or investment recommendation. Past performance is not an indication of future results.
Copy Trading does not amount to investment advice. The value of your investments may go up or down. Your capital is at risk.
Crypto assets are complex and carry a high risk of volatility and loss. Trading or investing in crypto assets may not be suitable for all investors. Take 2 mins to learn more
eToro USA LLC does not offer CFDs and makes no representation and assumes no liability as to the accuracy or completeness of the content of this publication, which has been prepared by our partner utilizing publicly available non-entity specific information about eToro.
