The relative strength index is a technical indicator used in the analysis of financial markets.
The Relative Strength Index (RSI) is a momentum oscillator developed by J. Welles Wilder that measures the speed and change of price movements. It ranges from 0 to 100 and determines whether an asset is overbought or oversold. Typically, an RSI above 70 indicates that an asset is overbought, while an RSI below 30 suggests that it is oversold.
Following useful facts about RSI:
- RSI is used to measure the momentum of all sorts of assets, from stocks and commodities to cryptocurrencies.
- RSI alone is not an accurate measure of the market. An oversold RSI below 30 may not result in a price gain, and an overbought RSI above 70 may not result in a price drop. RSI can be applied across.
- RSI can be applied across various timeframes, including monthly, weekly, and daily situations.
- RSI is used in conjunction with other trading indicators to have a better grasp of the market sentiment.
What is a good RSI ratio?
There is no such thing as a single good RSI ratio. It all depends on what you are looking for in the market. If you want to make an effective long-term buy, it is generally advisable to wait for the RSI to drop to neutral territory. Oversold levels below 30 are the most desirable while making a purchase.
If you want to profit by selling your asset, it is advisable to wait until the RSI ratio is at least above 50 in the neutral territory. Ideally, it needs to be above 70 and in the overbought space for this purpose.
But, there is no hard-and-fast rule here. During bullish market conditions, RSI can remain in deep overbought conditions for a long time and traders can still earn profits by engaging in short-term plays with RSI in mind. In bearish conditions, the RSI can remain in the oversold category for a long time and even then short-term traders can make a profit.
What are the Key Features of RSI?
Key features of RSI include assessing the speed and magnitude of price changes of an underlying asset. The objective here is to try to understand whether traders favor a move above or below.
Following are the key features and calculations associated with RSI:
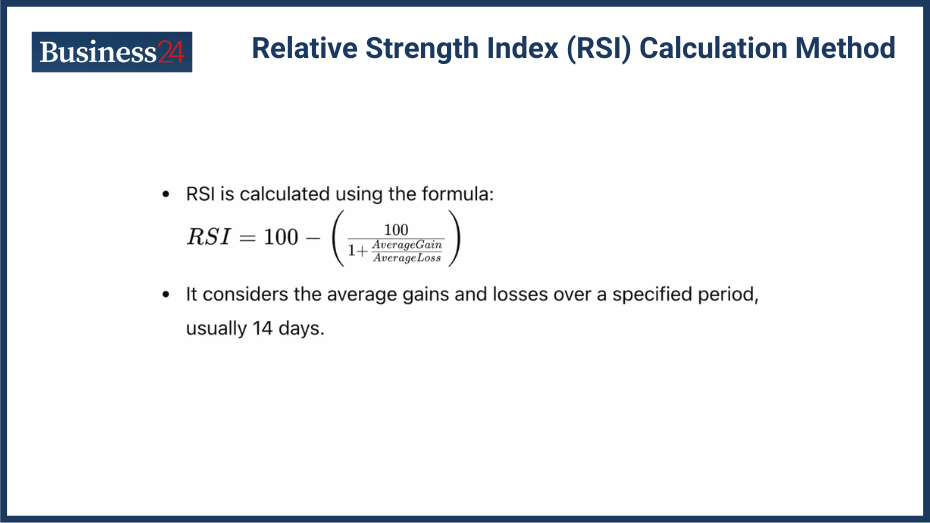
Calculation Method:
There are advanced RSI calculation tools available on popular price analysis websites like TradingView and most digital brokerage platforms. To manually calculate RSI, follow these steps:

You can adjust the period from 14 days based on your own requirements.
To calculate the average gain, you need to select a closing time for each day. The difference between the closing price levels of subsequent days will either show a net gain or a net loss. To calculate the average gain, you need to add all net gains to a running total, and for average loss, you need to add all net losses to a running total.
After the chosen 14 days or any other time period, you use the simple RSI equation to calculate. If there are more gains than losses, the RSI is likely to go above 50 and show overbought conditions. If there are more losses than gains, the RSI is likely to go below 50 and into oversold conditions.
Day 1: Avg Gain = 0, Avg Loss = 0 (no prior data)
Day 2: Avg Gain = (42 – 40) = 2, Avg Loss = abs(42-40) = 2
Day 3: Avg Gain = [(2 x 4) + 3] / 5 = 1.8, Avg Loss = [ (2 x 4) + abs(45-42)] / 5 = 2.2
… (repeat calculations for Days 4 and 5)
After Day 5: Avg Gain = 1.5, Avg Loss = 1.8
Relative Strength (RS): RS = 1.5 / 1.8 = 0.833
RSI: RSI = 100 – (100 / (1 + 0.833)) = 33.33 (approximately).
Users can smoothen the overall calculation by engaging in a dynamic calculation. Instead of complicating calculations like running totals, analysts can simply use this equation to determine average gains and losses:
New Avg Gain = (Previous Avg Gain x (Number of Periods – 1)) + Current Gain
New Avg Loss = (Previous Avg Loss x (Number of Periods – 1)) + Absolute Value(Current Loss)
Overbought and Oversold Levels:
Overbought: An RSI above 70 typically indicates that an asset may be overbought and a potential sell signal. An overbought signal indicates that the price index has risen too quickly, and it may be in for a correction because of overvaluation. However, RSI alone is not one of the best trading signals out there. It should always be used in conjunction with other indicators. Traders should avoid using it without understanding the market context.
Oversold: An RSI below 30 generally suggests that an asset may be oversold and a potential buy signal. An oversold condition means that the price has dropped sharply and is in line to post a price appreciation. Just as with overbought conditions, oversold RSI indications alone are not among the best trading signals out there. They should always be used in conjunction with other technical indicators.
Divergence:
Divergence occurs when the price of an asset moves in the opposite direction of the RSI. Traders need to identify potential reversals in price trends, and this is where the divergence between the RSI and the spot price index comes into play.
Two types of divergence include:
- A bullish divergence occurs when the price keeps on falling and posting relative lows but the RSI doesn’t keep following this trend and remains somewhat stable. This shows that despite the price decrease, there is a chance of a weakening downtrend and a price reversal could be on the cards.
- A bearish divergence occurs when the spot price continues to post new highs but RSI doesn’t follow this trend and posts lower highs and refuses to budge significantly. This means that the market can expect a weakening upward trend and a possible price drop.
Divergences by no means guarantee a price reversal, but they are better at predicting the future than relying solely on RSI alone. Divergence in RSI can be a leading indicator compared to RSI itself as it can precede a change in the price level or the RSI itself. This is why Divergence in RSI is used extensively by day traders, but they can be misleading at times. The price may not reverse its trend after a divergence situation presents itself, but nevertheless, it is an important tool for understanding market conditions.
What are the Practical Applications of RSI?
Identifying Trends:
RSI can help determine the general trend of an asset. In a strong uptrend, the RSI tends to stay above 50, with readings typically between 60 and 90. In a downtrend, the RSI generally stays below 50, with readings typically between 20 and 40. This is a rudimentary understanding of the role of RSI in identifying trends.
The slope of an RSI can be used to identify the strength of a trend. A steady, flatlining RSI trend shows that the market is dull and waiting for an external stimulus to speed things up. A steeply rising RSI means that there is the possibility of a major uptrend. This can become a buying opportunity. A steeply declining RSI means that there is significant buying and selling momentum. This can be a selling opportunity.
Divergence in RSI also plays an important role in identifying market trends. If the change in RSI doesn’t correlate with the change in the index, it creates a situation of divergence. A bullish divergence occurs when a price decrease isn’t adequately reflected in the RSI. Normally, when a market goes down, the RSI should also come down, but that doesn’t happen in this case, and this is an indication of a potential trend reversal in the favour of the bulls. The opposite situation presents itself in the bearish scenario when an increasing spot price doesn’t correlate with the RSI, which refuses to go significantly higher. This is a selling opportunity favoring the bears.
Generating Trading Signals:
Buy Signals: Generated when the RSI falls below 30 and then rises above it. Buy signals are represented by green markers,and bay traders and swing traders take advantage of these tignals.
Sell Signals: Generated when the RSI rises above 70 and then falls below it. Sell signals are represented by red markers,and they are also used by bwing traders and retail (day traders).
Detecting Overbought and Oversold Conditions:
Adjusting the thresholds to 80 for overbought and 20 for oversold can help in volatile markets or for more precise signals. RSI below 20 showcases an extremely oversold situation in the market. This means that the underlying asset’s price has fallen sharply, and it could be a good buy. Conversely, an RSI above 80 means that the asset is experiencing overbought conditions, and it could be a time to sell. However, it needs to be stressed that RSI alone isn’t an accurate predictor of the future. Various other analytical tools are needed to make sense of the prevailing RSI levels.
What does the RSI tell you?
The RSI is a yardstick to determine the speed and magnitude of recent market activity to assess the sentiment of the proceedings. It tells traders whether there is a buying, selling or neutral market sentiment in place.
However, the RSI doesn’t have the analytical depth to tell you the whole story behind the market sentiment. High or low RSI levels don’t guarantee future price movements. In a major bullish move, the RSI can remain in overbought territory, even above 70, for a long time. Similarly, in a major bearish offensive, the RSI can remain in deep oversold territory, even below 30 for long periods of time, with no chance of a price reversal.
RSI is often used as a validating analytical tool to confirm other deeper analyses.
How is RSI Used in Different Trading Strategies?
Convergence and Divergence:
Positive and negative reversals in RSI can signal potential price reversals in the market. Convergence is when the spot price and the RSI start to correlate strongly with each other once more after a divergent phase. Both divergence and convergence are of great interest to day traders and swing traders. Divergence is the more important metric here as it occurs less frequently and flashes a potential trading signal before it ultimately makes way for convergence once again.
Divergence in RSI also plays an important role in identifying market trends. If the change in RSI doesn’t correlate with the change in the index, it creates a situation of divergence. A bullish divergence occurs when a price decrease isn’t adequately reflected in the RSI. Normally, when a market goes down, the RSI should also come down, but that doesn’t happen in this case, and this is an indication of a potential trend reversal in the favour of the bulls.
RSI with Moving Averages:
Combining RSI with moving averages can enhance the accuracy of the trading signals by confirming trends and potential reversal points. RSI is used to gauge the momentum of the market’s price movements, while moving averages remove noise from a trading graph. Together, they are effective tools for predicting the price movement of an underlying asset.
RSI and Moving Averages are used for the following complementing analytical strategies:
- Confirming overbought/oversold conditions
- Identification of trend strength
- Potential selling/buying points
Is a high RSI good?
A high RSI, typically above 70 shows that the underlying security or asset is showing overbought conditions. This means that a potential price decline may be on the cards, and traders will look to sell. However, RSI alone isn’t an accurate prediction of the market sentiment. It is often used to complement other technical analyses to arrive at a trading signal.
What is a good RSI signal?
There is no one “good” RSI signal as it all depends on your trading strategy and the prevailing market conditions. Generally, above 70 RSI is considered overbought (time to sell) while below 30 is oversold (time to buy).
Educational Resources and Tools for RSI
Books include:
- RSI: The Complete Guide by John Hayden
- Dear Traders, There is Magic in RSI by Sudhir Dixit
- Mastering the RSI Trading Indicator by Lalit Mohanty
Articles include:
Article on Investopedia
Article on Fidelity Investments
Course on Udemy
Trading Simulators: Platforms to practice using RSI without financial risk.
Forex.com Demo
eToro Demo
Disclaimer
eToro is a multi-asset platform which offers both investing in stocks and cryptoassets, as well as trading CFDs.
Please note that CFDs are complex instruments and come with a high risk of losing money rapidly due to leverage. 51% of retail investor accounts lose money when trading CFDs with this provider. You should consider whether you understand how CFDs work, and whether you can afford to take the high risk of losing your money
This communication is intended for information and educational purposes only and should not be considered investment advice or investment recommendation. Past performance is not an indication of future results.
Copy Trading does not amount to investment advice. The value of your investments may go up or down. Your capital is at risk.
Don’t invest unless you’re prepared to lose all the money you invest. This is a high-risk investment and you should not expect to be protected if something goes wrong. Take 2 mins to learn more
eToro USA LLC does not offer CFDs and makes no representation and assumes no liability as to the accuracy or completeness of the content of this publication, which has been prepared by our partner utilizing publicly available non-entity specific information about eToro.

Braden Chase is an investor, trading specialist, and former research specialist for Forex.com who helps aspiring investors develop the confidence and habits they need to make an income from the market. Braden has served as a registered commodity futures representative for domestic and internationally-regulated brokerages and has also spoken & moderated numerous forex and finance industry panels across the globe.